What are the largest uranium companies in the world by market cap? We run through the biggest firms producing and exploring for the nuclear fuel.
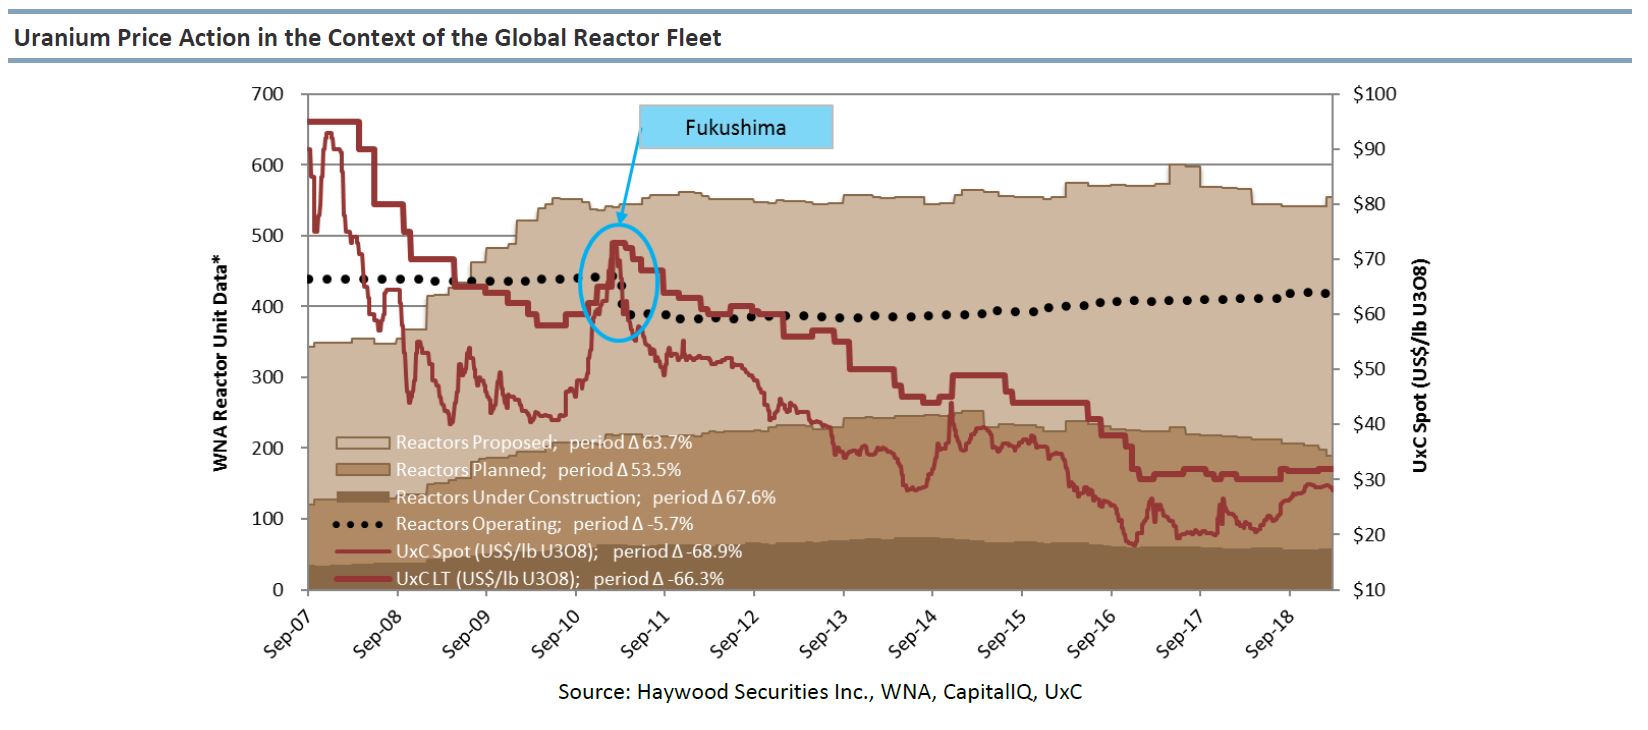
Uranium began this year at US$39.50 per pound, and prices tracked much higher during the first quarter, pushing the energy fuel to an 11 year high of US$63.50 in mid-April.
Various factors have pushed prices upward. Production declines caused by COVID-19-related closures in 2020 have played a role, as has widespread demand for nuclear power generation as a clean energy source.
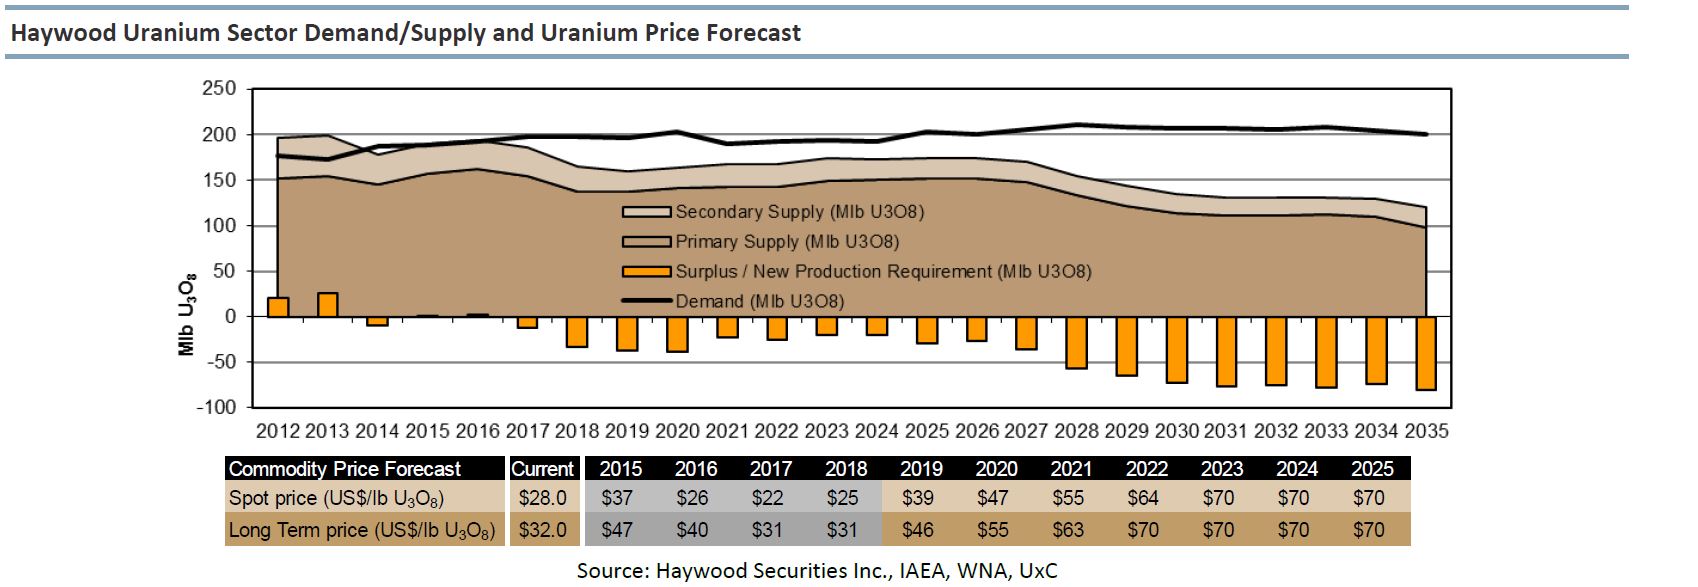
New nuclear technology will require more uranium output, which bodes well for uranium-producing companies. The long-term outlook for uranium shows that demand is projected to climb 25 percent higher by 2025. This uptick will largely come from Asia's robust and growing nuclear energy industry.
There is also increasing interest in small modular reactors. Capitalizing on the same processes used to create nuclear power on a smaller scale, they offer another way to integrate atomic energy into a project or energy grid.
Aside from that, eyes are on competition in the spot market from uranium producers that are purchasing to meet contracts following a year of mine shutdowns and logistical woes. Utilities are beginning to make deals again too, and the Sprott Physical Uranium Trust (TSX:U.UN) has become a key buyer of uranium in its own right.
More recently, Russia’s war against Ukraine has served as a serious catalyst for uranium's value increase.
“Golden Rules” for Choosing Uranium Stocks:
1. Study the credentials of the company’s management team
2. Investigate the uranium property’s pedigree, a property’s past ownership and its institutional memory
3. Find out if a company is moving its flagship project(s) forward
4. Find out where the company’s uranium ore will be milled
5. Find out if the mining area is environmentally friendly or not
6. Political Risk
7. Find out about the depth of the company’s property portfolio
8. Find out if a company has partnered with a major company or institution
9. Find out how much money the company has raised
10. Find out if the company is likely to be a takeover candidate
URANIUM PRODUCTION – EXPECTATIONS VS. REALITY
Mike Alkin: “In my entire 20-plus year career as an analyst, this is the best risk/reward ratio on the long-site I’ve ever seen”
Doug Casey: “When the market wants into gold stocks it’s like trying to force the contents of Hoover Dam through a garden hose. In the case of uranium stocks, it’s more like a soda straw.”
Rob Chang: “Gear up for a violent uranium price spike!”
Feb 6, 2021 – Hugh Hendry: “A lot of you are invested in uranium. I commend you. I wish I was. Uranium is the rockstar of commodities. It doesn’t mess around – bull and bear markets are of epic proportions.” https://twitter.com/hendry_hugh/status/1358107357516083202?s=20
Feb 14, 2021 – Michael Burry Joins The Uranium Craze: https://www.zerohedge.com/markets/michael-burry-joins-uranium-craze
March 31, 2021 – Marcelo Lopez: “I have never been as bullish on uranium as I am today, but probably a bit less bullish than what I will be tomorrow” https://www.youtube.com/watch?v=3WHI9cDyA7k
April 04, 2021 – ZeroHedge: “One Step Away From “ESG”: Why Uranium Stocks Are About To Soar” https://www.zerohedge.com/markets/one-step-away-esg-why-uranium-stocks-are-about-soar

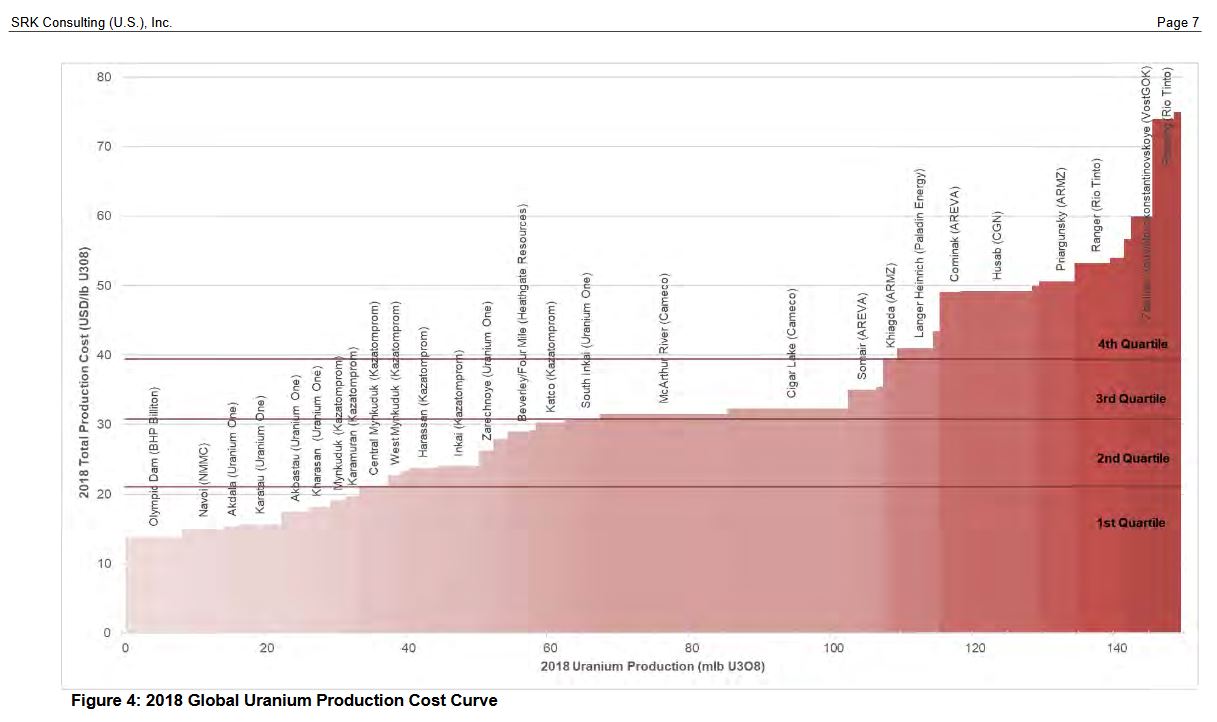
BASIC ECONOMICS: YOU CAN’T SPEND $60 A POUND TO MAKE URANIUM AND WE SELL IT FOR $35 A POUND. EITHER THE URANIUM PRICE GOES UP OR THE LIGHTS GO OUT!
We built a model to create quantitative rankings of uranium equities based on the following fundamental and technical factors:
- momentum
- trend
- liquidity
- insider support,
- institutional support,
- sentiment,
- valuation,
- volatility,
- capital structure,
- performance
- relative strength.
Please see the appendix for details on specific model inputs and weightings. The list below contains Canadian and
Australian equities with market caps of C$10M or greater. These rankings can be used by clients to find short to intermediate term trading
ideas (3-6 months or less), while our model portfolio serves as our preferred names to hold for the long-term (1-3+ years).
Instrument table
| Name | ISIN | Rating | Price | Currency | Market Cap (m) |
|---|---|---|---|---|---|
| ISINCA2926717083 | RatingBuy | Price- | CurrencyUSD | Market Cap (m)975 | |
| ISINCA91688R1082 | RatingBuy | Price- | CurrencyUSD | Market Cap (m)238 | |
| ISINUS9168961038 | RatingHold | Price- | CurrencyUSD | Market Cap (m)1,048 | |
| ISINCA2483561072 | Rating- | Price- | CurrencyUSD | Market Cap (m)892 | |
| ISINCA13321L1085 | Rating- | Price- | CurrencyUSD | Market Cap (m)9,758 | |
| ISINCA65340P1062 | Rating- | Price- | CurrencyUSD | Market Cap (m)1,814 |
Position Your Portfolio for a Nuclear Decade
Uranium Supply/Demand Model
|
| 2017 | 2018 | 2019 | 2020 | 2021 | 2022 | 2023E | 2024E | 2025E |
Mine Supply - Western World (Mlb U308) |
|
|
|
|
|
|
|
|
|
|
Total Mine Supply - Western World |
| 100 | 83 | 85 | 75 | 76 | 80 | 85 | 88 | 86 |
Net Eastern Mine Supply |
| 54 | 54 | 55 | 44 | 52 | 53 | 60 | 66 | 72 |
Total World Mine Supply (Mlb U308) |
| 154 | 138 | 140 | 119 | 128 | 133 | 145 | 154 | 158 |
| YoY % change | -7.6% | -10.2% | 1.7% | -15.2% | 7.9% | 3.3% | 9.1% | 6.8% | 2.6% |
|
|
|
|
|
|
|
|
|
|
|
Total World Demand |
|
|
|
|
|
|
|
|
|
|
Total World Nuclear Generating Capactity (MWe) |
| 358819 | 368571 | 372978 | 374420 | 384508 | 285211 | 389242 | 394906 | 3998885 |
Uranium Demand |
| 139 | 174 | 176 | 177 | 181 | 182 | 184 | 186 | 188 |
Total World Demand |
| 169 | 174 | 176 | 177 | 181 | 1823 | 184 | 186 | 188 |
| YoY % change | 1.7% | 2.7% | 1.2% | 0.4% | 2.7% | 0.2% | 1.0% | 1.5% | 1.0 |
|
|
|
|
|
|
|
|
|
|
|
Supply/Demand Balance (Mlb) |
| 18 | -5 | -3 | -27 | -24 | -21 | -11 | -4 | -2 |
UxC, TD Securities Inc